McUtils.Zachary
Handles all of the “numerical math” stuff inside Mcutils which made it balloon a little bit
Members:
- FiniteDifferenceFunction
- FiniteDifferenceError
- finite_difference
- FiniteDifference1D
- RegularGridFiniteDifference
- IrregularGridFiniteDifference
- FiniteDifferenceData
- FiniteDifferenceMatrix
- FunctionExpansion
- FiniteDifferenceDerivative
- Mesh
- MeshType
- Tensor
- TensorOp
- LazyOperatorTensor
- SparseTensor
- BaseSurface
- TaylorSeriesSurface
- LinearExpansionSurface
- LinearFitSurface
- InterpolatedSurface
- Surface
- MultiSurface
- FittableModel
- LinearFittableModel
- LinearFitBasis
- Interpolator
- Extrapolator
Examples:
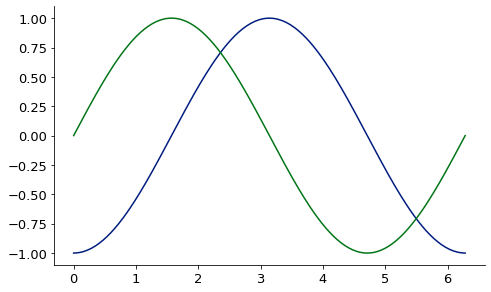
1D finite difference derivative via finite_difference:
from McUtils.Zachary import finite_difference
import numpy as np

sin_grid = np.linspace(0, 2*np.pi, 200)
sin_vals = np.sin(sin_grid)

deriv = finite_difference(sin_grid, sin_vals, 3) # 3rd deriv
base = Plot(sin_grid, deriv, aspect_ratio = .6, image_size=500)
Plot(sin_grid, np.sin(sin_grid), figure=base)

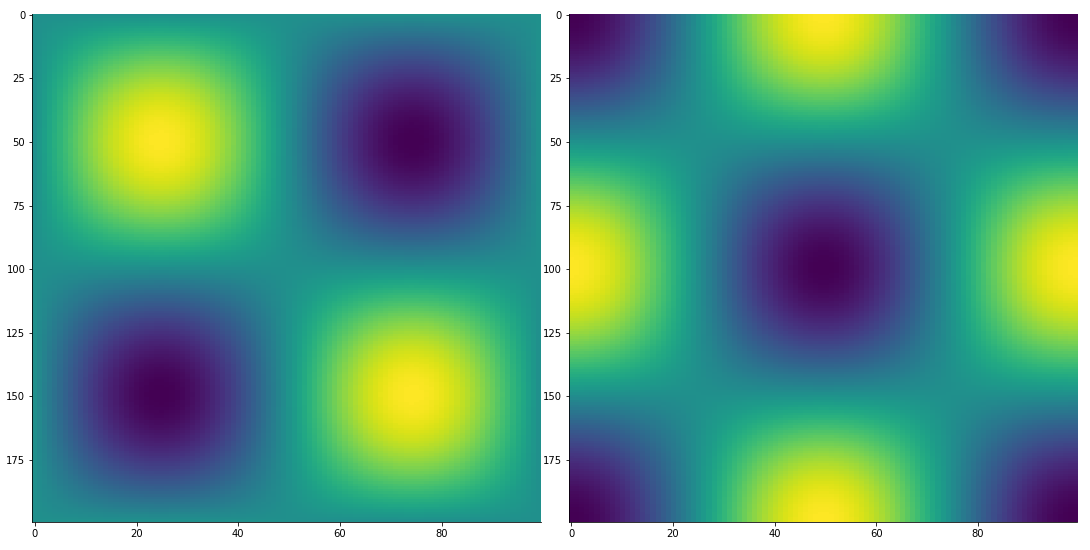
2D finite difference derivative via finite_difference:
from McUtils.Zachary import finite_difference
import numpy as np

x_grid = np.linspace(0, 2*np.pi, 200)
y_grid = np.linspace(0, 2*np.pi, 100)
sin_x_vals = np.sin(x_grid); sin_y_vals =  np.sin(y_grid)
vals_2D = np.outer(sin_x_vals, sin_y_vals)
grid_2D = np.array(np.meshgrid(x_grid, y_grid)).T

deriv = finite_difference(grid_2D, vals_2D, (1, 3))
TensorPlot(np.array([vals_2D, deriv]), image_size=500)

Create a convenient, low-order expansion of a (potentially expensive) function
def sin_xy(pt):
    ax = -1 if pt.ndim>1 else 0
    return np.prod(np.sin(pt), axis=ax)

point = np.array([.5, .5])
# create the function expansions
exp1 = FunctionExpansion.expand_function(sin_xy, point, function_shape=((2,), 0), order=1, stencil=5)
exp2 = FunctionExpansion.expand_function(sin_xy, point, function_shape=((2,), 0), order=2, stencil=6)
exp4 = FunctionExpansion.expand_function(sin_xy, point, function_shape=((2,), 0), order=4, stencil=6)

# create a test grid and plot the approximations
test_grid = np.vstack([np.linspace(-.5, .5, 100), np.zeros((100,))]).T + point[np.newaxis]
g = test_grid[:, 0]
gg = GraphicsGrid(nrows=1, ncols=3, subimage_size=350)
for i, e in zip(range(3), (exp1, exp2, exp4)):
    # plot the real answer
    gg[0, i] = Plot(g, sin_xy(test_grid), figure=gg[0, i])
    # plot the expansion
    gg[0, i] = Plot(g, e(test_grid), figure=gg[0, i])

expansions work in multiple dimensions, too
mesh = np.meshgrid(np.linspace(.4, .6, 100, dtype='float128'), np.linspace(.4, .6, 100, dtype='float128'))
grid = np.array(mesh).T
gg2 = GraphicsGrid(nrows=2, ncols=3, subimage_size=350)
# plot error in linear expansion
styles=dict(ticks_style=(False, False), plot_style={'vmin':np.min(sin_xy(grid)), 'vmax':np.max(sin_xy(grid))})
gg2[0, 0] = ContourPlot(*mesh, sin_xy(grid), figure=gg2[0, 0], **styles)
gg2[0, 1] = ContourPlot(*mesh, exp1(grid), figure=gg2[0, 1], **styles)
# when we plot the error, we shift it so that it's centered around the average function value to show the scale
# of the error
gg2[0, 2] = ContourPlot(*mesh,
                        np.average([np.min(sin_xy(grid)), np.max(sin_xy(grid))]) + sin_xy(grid)-exp1(grid),
                        figure=gg2[0, 2], **styles)
# plot error in quadratic expansion
gg2[1, 0] = ContourPlot(*mesh, sin_xy(grid), figure=gg2[1, 0], **styles)
gg2[1, 1] = ContourPlot(*mesh, exp2(grid), figure=gg2[1, 1], **styles)
gg2[1, 2] = ContourPlot(*mesh,
                        np.average([np.min(sin_xy(grid)), np.max(sin_xy(grid))]) + sin_xy(grid)-exp2(grid),
                        figure=gg2[1, 2], **styles)

Edit Examples or
Create New Examples
Edit Template or
Create New Template
Edit Docstrings