GraphicsGrid
A class for easily building sophisticated multi-panel figures.
Robustification work still needs to be done, but the core interface is there.
Supports themes & direct, easy access to the panels, among other things.
Builds off of GraphicsBase.
default_style: dict
layout_keys: set
known_keys: set
GraphicsStack: GraphicsStack
__init__(self, *args, nrows=None, ncols=None, graphics_class=<class 'McUtils.Plots.Graphics.Graphics'>, figure=None, axes=None, subplot_kw=None, subimage_size=(310, 310), subimage_aspect_ratio='auto', padding=None, spacings=None, **opts):
initialize_figure_and_axes(self, figure, axes, *, nrows=None, ncols=None, graphics_class=None, fig_kw=None, subplot_kw=None, padding=None, spacings=None, subimage_size=None, subimage_aspect_ratio=None, **kw):
Initializes the subplots for the Graphics object
figure:Anyaxes:Anyargs:Anykw:Any:returns:GraphicsBackend.Figure, GraphicsBackend.Figure.Axesf i g u r e ,
a x e s
set_options(self, padding=None, spacings=None, background=None, colorbar=None, figure_label=None, **parent_opts):
__iter__(self):
__getitem__(self, item):
__setitem__(self, item, val):
set_image(self, pos, val, **opts):
calc_image_size(self):
@property
image_size(self):
@property
figure_label(self):
@property
padding(self):
@property
padding_left(self):
@property
padding_right(self):
@property
padding_top(self):
@property
padding_bottom(self):
@property
spacings(self):
@property
background(self):
@property
colorbar(self):
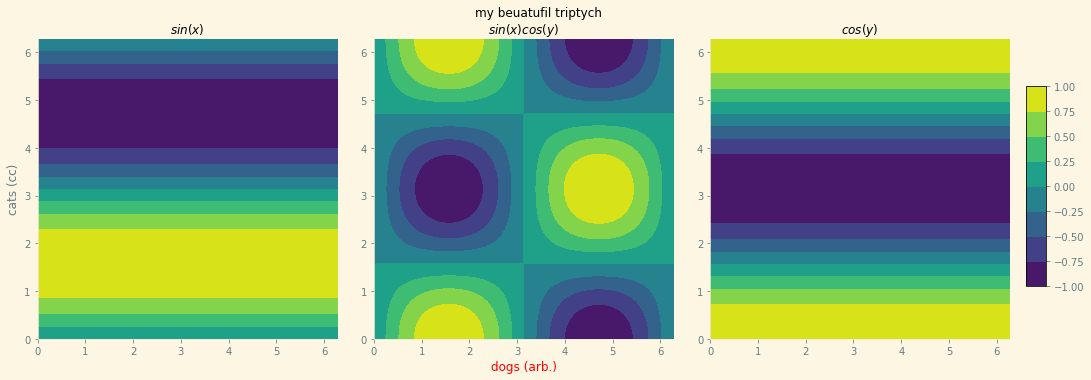
Examples
Create a multi-panel figure
grid = np.linspace(0, 2 * np.pi, 100)
grid_2D = np.meshgrid(grid, grid)
x = grid_2D[1]
y = grid_2D[0]

main = GraphicsGrid(ncols=3, nrows=1, theme='Solarize_Light2', figure_label='my beuatufil triptych',
                            padding=((35, 60), (35, 40)), subimage_size=300)
main[0, 0] = ContourPlot(x, y, np.sin(y), plot_label='$sin(x)$',
                         axes_labels=[None, "cats (cc)"],
                         figure=main[0, 0]
                         )
main[0, 1] = ContourPlot(x, y, np.sin(x) * np.cos(y),
                         plot_label='$sin(x)cos(y)$',
                         axes_labels=[Styled("dogs (arb.)", {'color': 'red'}), None],
                         figure=main[0, 1])
main[0, 2] = ContourPlot(x, y, np.cos(y), plot_label='$cos(y)$', figure=main[0, 2])
main.colorbar = {"graphics": main[0, 1].graphics}